Beratung
Entwicklung
Projektleitung
- De
- Sk
- En
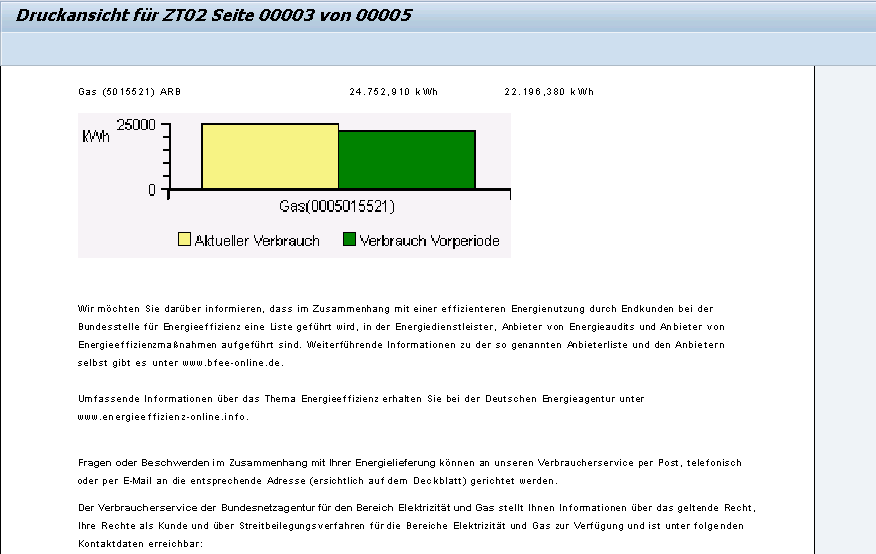
Dynamic charts for SapScripts / Smart forms
Best solution which allows you to insert dynamically generated charts into Smartforms - resp. SapScript-like forms (invoices, billing documents, ...).
This solution is intented to work in the following way:
- Standard IS-U (or any other) printing process is triggered,
- Tabular data which were intended to be shown on a form are formatted into common chart´s input structure,
- Generation of a dynamic chart using IGS (Internet Graphics Service) is called with supplied data and generated chart (BMP image) is retrieved,
- Generated image is shown in the form.
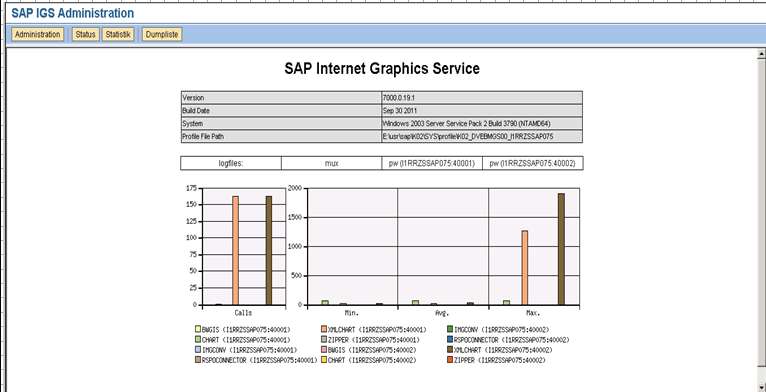
IGS verification
An essential prerequisite to use the current way of dynamically generated charts is to have a service called IGS installed and running. IGS configuration is up to responsibility of basis team! If you´re not a part of basis you can only verify the status of the service.
This verification can be done via tr. SIGS. If IGS is correctly customized and is reachable using a default RFC destination - IGS_RFC_DEST - you will be able to see a similar output of tr. SIGS.
If IGS is not properly customized a corresponding error message is shown.
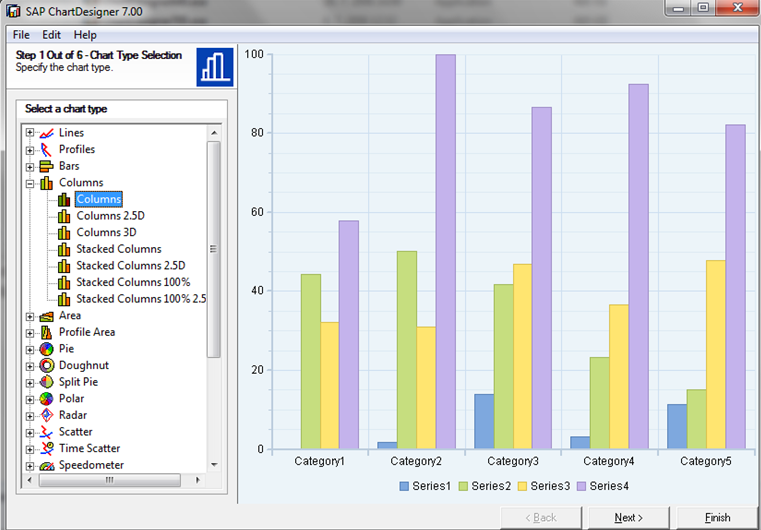
SAP Chart Designer
To make a work with IGS charts easier, SAP has developed a tool to generate XML file which determines a type and look of resultant graphics called ChartDesigner. There are two versions (6.40, 7.00) of this software where each corresponds to the certain version of the IGS installed on the system. You can read out the version from the tr. SIGS.
When creating an XML with customizing you are being navigated through an intuitive wizard where you choose:
- Type of chart - bars, rows, ... ,
- Count of series - bars/rows which are compared within 1 category,
- Count of categories - allows you to create multiple groups of columns (whatever) one next to another,
- Colors of graph,
- Measurement units, labels, ...
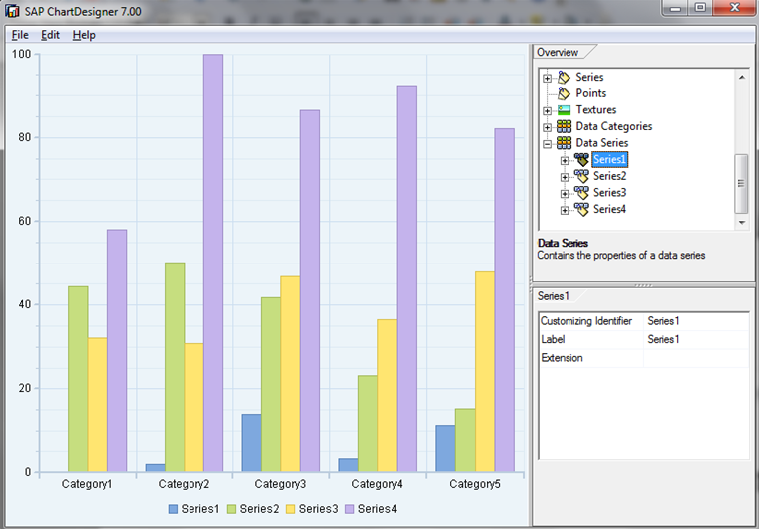
After clicking through whole wizard you will get into a summary screen when all customized data are wrapped into one tree structure.
What is important here is that you are not allowed to change the ID (Customizing Identifier) of the series if you want to use the generated customizing in our solution. Otherwise colors and other properties of the generated graph will not be properly assigned to the customizing. In other words, it´s necessary to leave identifiers of series in the format Series 1, Series 2, ...Series N...
Note: Always pick colors which are feasible from the contrast point of view if they are printed on the black-ink printers.
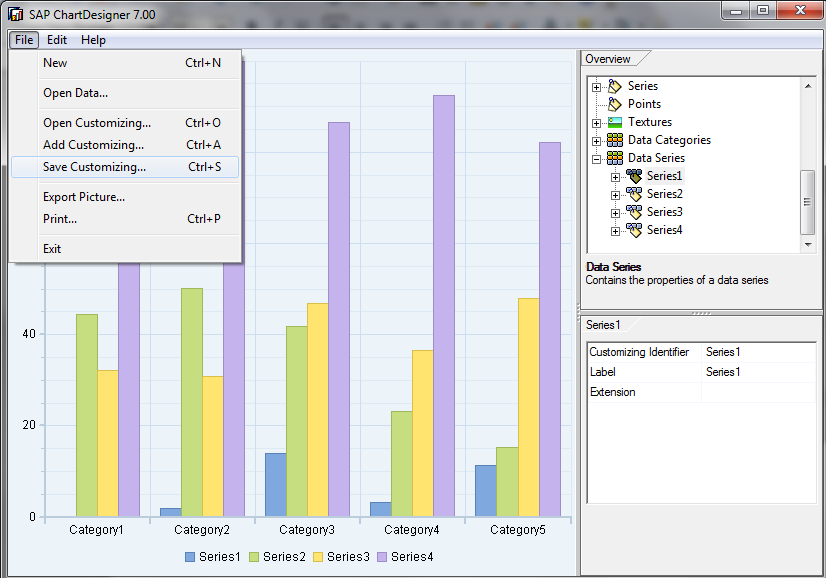
One, you are finished with customizing you will export the customizing into XML file. Then you open this XML file in any text editor or web-browser and you are ready to transfer it into SAP system and move to the next step.
Chart customizing
This step describes how the customizing generated via ChartDesigner is assigned to the certain usage in the SAP system. A prerequisite of this step is to have an XML generated by previous step. There is a simple report created for this activity. It´s only purpose to validate & save passed XML into database. This XML is assigned to a certain key called "Usage ID". Onto this ID it´s later referred from the application (printing) logic.
When you open the specified usage ID an editor, where you paste generated XML, is opened. However, it´s not enough only to paste and output of ChartDesigner here but you have to add a few lines in (highlighted in the second screenshot of this chapter). These additional parameters (tags) are:
- Height
- Width
- FileType
Once an assignement of the chart is properly customized the test can be performed.
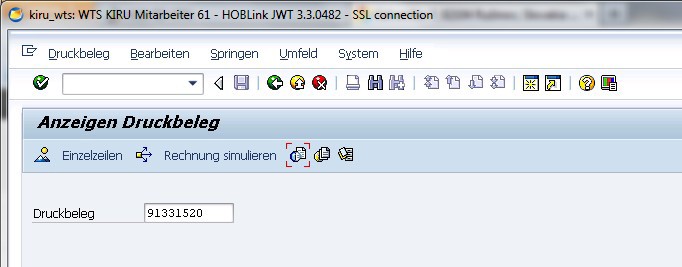
- Open the transaction EA40,
- Enter a bill number,
- Display a form with the chart with the icon marked by red frame in the previous screenshot.
Image: